Quants VS Retail concepts
Quants are right about intraday trading. At low frequency it's less clear: you can't statistically prove an edge for years, returns mostly come from factor exposure, and the real risk is quitting during a drawdown.
Quants tend to dismiss "retail" trading concepts outright: resistance lines, chart patterns, trading psychology, "follow your plan". On intraday trading, they're right. It's a brutally competitive game, and you won't win it by drawing lines on a chart.
But at low frequency, the picture changes. You can't statistically prove an edge for years, most of the returns come from factor exposure rather than skill, and the biggest risk isn't a bad trade: it's giving up on the strategy in the middle of a drawdown. That's where some of the retail basics, having a plan and sizing your positions, start to matter. And where you can still find good strategies.
1. Why quants are right about intraday
Start with a simple question: where does intraday profit come from?
My answer is statistical arbitrage. If you make money intraday, it's because your trades make the market slightly more efficient: you correct a mispricing, provide liquidity where it's missing, and you get paid for that service.
Which means a retail intraday trader competes directly with quant firms that have better data, better infrastructure, and lower costs. Nice chart drawings don't win that fight. Yes, some retail intraday traders do make money, but when you only hear from the winners, it's hard to tell skill from survivorship bias.
A lot of retail content focuses on "perfect execution" and "the mindset to follow your plan". My question is: why not automate the plan? You'd get perfect execution for free, and you could run it on many assets at once. The catch is that automation also tells you, quickly and without excuses, whether the plan was any good.
Intraday trading is hard for retail traders and professional firms alike. You get paid for the value your trades bring to the market, and the competition for that value is huge.
2. At low frequency, it's less clear
You can't prove an edge in a reasonable time
The Sharpe ratio measures return per unit of risk: your average annual return divided by its volatility. To test whether a strategy has an edge, the simplest approach is a t-test on its annual returns, with "no edge" (an average return of zero) as the null hypothesis.
The t-statistic of that test turns out to be remarkably simple: it's your annual Sharpe ratio times the square root of the number of years of data. To be significant at the usual 5% level, you need t > 1.96, so:
A strategy with a Sharpe of 0.5, which is already respectable, needs about 15 years of data before the test can tell it apart from luck. And this assumes well-behaved, independent returns. Fat tails, autocorrelation, and a Sharpe that drifts over time all make it longer (Lo, 2002).
So with a low-frequency strategy, you will basically never know, statistically, whether you have an edge.
So where does the money come from?
At low frequency, most of the returns come from factor exposure: being exposed to well-known sources of return like the market itself (beta) or momentum. Not from a statistical edge.
Here's a concrete example: my Ichimoku strategy on BTC, with the classic 9/26/52 settings, either long or in cash, and 0.1% fees per trade, compared with simply buying and holding bitcoin. I've been running it live since May 2023, so the results split cleanly into a backtest period and a live period.
The rules, evaluated on daily closes:
- Enter long when three conditions hold at once: the Tenkan-sen is above the Kijun-sen, the price is above the cloud, and the future cloud is bullish (Senkou Span A above Senkou Span B).
- Exit to cash as soon as the price falls back into the cloud.
| Metric | Ichimoku | Buy & Hold BTC |
|---|---|---|
| CAGR (2015 → 2026) | 69% | 60% |
| Max drawdown | -47% | -84% |
| Longest drawdown | 785 days | 1,079 days |
| Time in market | 47% | 100% |
| Sharpe, backtest (2015 → Apr 2023) | 1.52 (t = 4.4) | 1.10 (t = 3.2) |
| Sharpe, live (May 2023 → Oct 2026) | 1.05 (t = 1.94) | 0.89 (t = 1.64) |
| CAGR, live | 31% | 35% |
| Max drawdown, live | -33% | -53% |
Look at the live Sharpe: 1.05 over 3.45 years gives t = 1.94, just below the 1.96 threshold. That's exactly what the chart above predicts. With a Sharpe around 1, you need about 3.5 to 4 years of data, and the strategy is just short of it. The result barely moves with autocorrelation-robust standard errors (t = 1.91).
And even a significant Sharpe doesn't prove an edge. Buy and hold is significant too, and it looks great on a chart. Over the live period it even returned more than the strategy (35% a year against 31%), with a lower Sharpe and a much deeper drawdown.
Why psychology matters
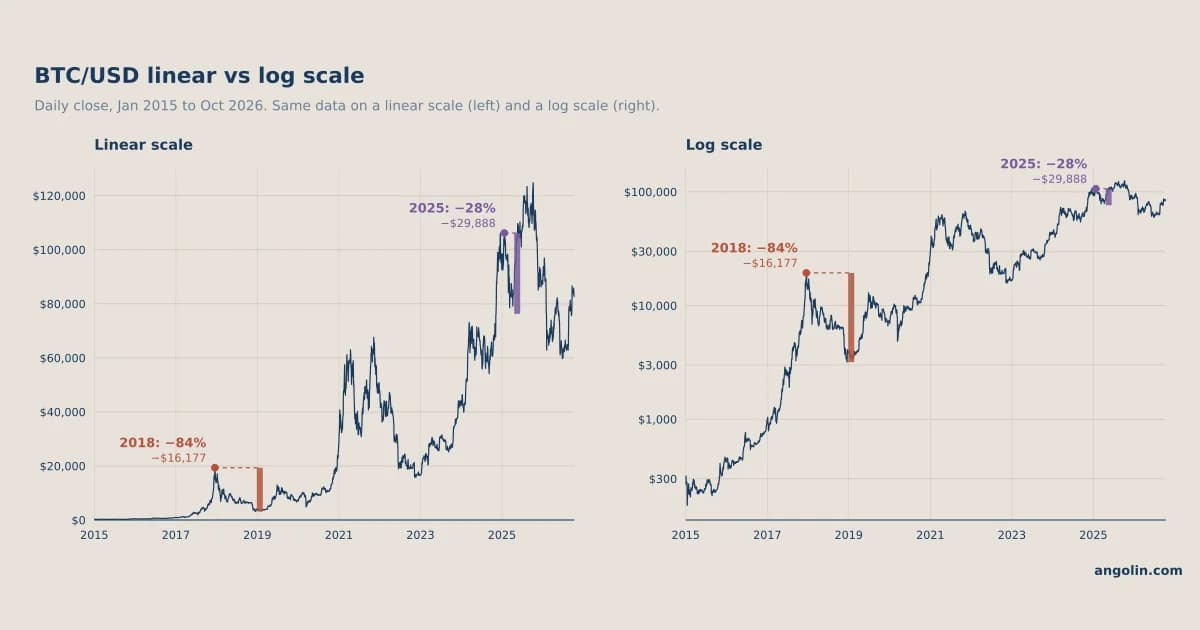
The question that actually decides the outcome is a different one. Would you have kept holding bitcoin at -84%, and stayed underwater for almost three years?
It's easy to say yes looking back. It's much harder while you're living it. Ichimoku's worst drawdown was -47%, and it sat in cash more than half the time.
The bet behind the strategy
Do I have an edge with Ichimoku on BTC? Honestly, I don't know, and by the numbers above, nobody can know yet. But I can explain the bet I'm making.
Ichimoku is a trend-following tool, so it's essentially exposure to time-series momentum: assets that have been going up tend to keep going up for a while, and the same on the way down. It's one of the best-documented factors in finance (Moskowitz, Ooi & Pedersen, 2012). Crypto is a FOMO-driven market that trends hard, and that's where Ichimoku shines. It fails when the market goes nowhere, and on pump-and-dumps.
So my bet is simple: bitcoin will keep trending.
Conclusion
Here's the difference between the two worlds:
- Intraday, the psychological risk is execution, and automation fixes it.
- At low frequency, the risk is giving up on the strategy during a year-long drawdown. Even an automated system gets switched off by a human who panics.
That's why retail concepts like having a plan, money management, and position sizing can genuinely help traders who aren't full-time quants. A properly systematic strategy is still better. But at low frequency, the money comes from factor exposure, and what makes the difference is choosing the right exposure at the right time, and sticking with it. I'm not convinced the classical quant approach is the only way to do that well.
Rerun it yourself
The daily BTC history used here is available on Angolin. You can download it as a Parquet file, no API key needed, and rerun the backtest with your own settings.
References
- Moskowitz, T., Ooi, Y. H., & Pedersen, L. H. (2012). Time Series Momentum. Journal of Financial Economics.
- Lo, A. W. (2002). The Statistics of Sharpe Ratios. Financial Analysts Journal.
Angolin serves the full BTC history at 1d, 1h and 1m granularity.